Last article, we learned how to draw a uncolored map with python. Now, we are going to fill our country with beautiful colors.
Unified Color 1 2 3 4 5 6 7 8 9 10 11 12 13 14 15 16 17 18 19 20 21 22 23 24 25 26 27 28 29 import matplotlib.pyplot as plotfrom mpl_toolkits.basemap import Basemapfrom matplotlib.patches import Polygonplot.figure(figsize=(14 ,6 )) m = Basemap( llcrnrlon=77 , llcrnrlat=14 , urcrnrlon=140 , urcrnrlat=51 , projection='lcc' , lat_1=33 , lat_2=45 , lon_0=100 ) m.readshapefile(r'CHN_adm/CHN_adm1' , 'states' , drawbounds=True ) ax = plot.gca() for nshape, seg in enumerate (m.states): poly = Polygon(seg, facecolor='DeepSkyBlue' ) ax.add_patch(poly) m.readshapefile(r'TWN_adm/TWN_adm1' , 'states' , drawbounds=True ) ax = plot.gca() for nshape, seg in enumerate (m.states): poly = Polygon(seg, facecolor='DeepSkyBlue' ) ax.add_patch(poly) plot.show()
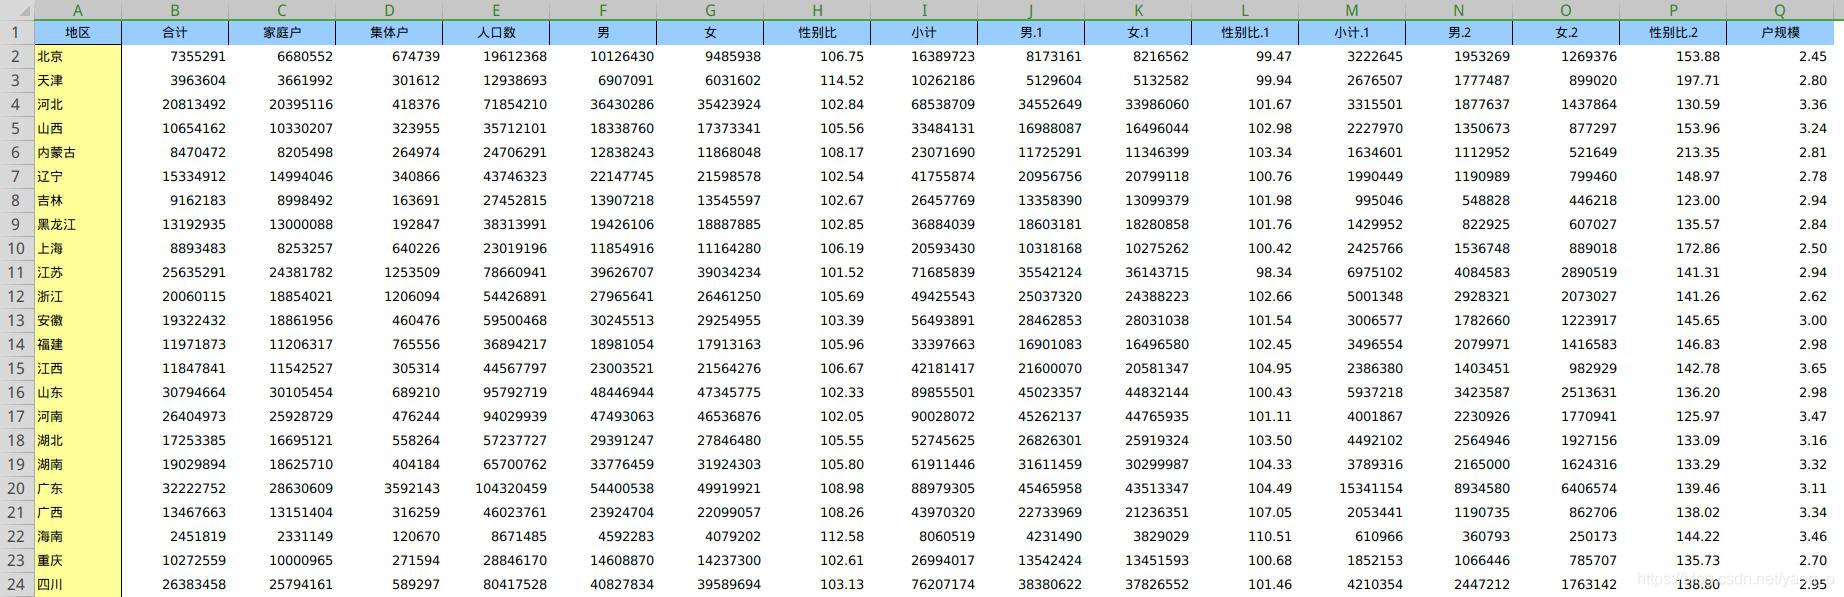
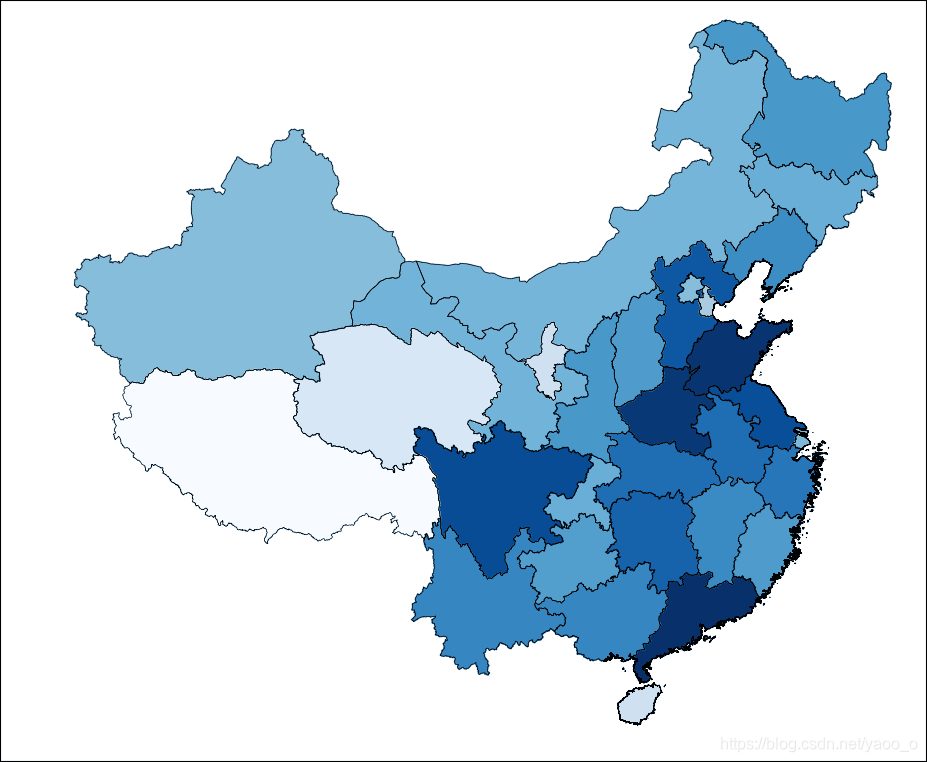
China population graph For further use, It will also use pandas , so install it.
1 pip install pandas --user
And here is the population data http://www.stats.gov.cn/tjsj/pcsj/rkpc/6rp/indexce.htm
After download it, modify the file until it looks like this:
The most important thing is that don’t forget to delete the space between province names!!!! This is important because I stuck because of this for a day.
1 2 3 4 5 6 7 8 9 10 11 12 13 14 15 16 17 18 19 20 21 22 23 24 25 26 27 28 29 30 31 32 33 34 35 36 37 38 39 40 41 42 43 44 45 46 47 48 49 50 51 52 import matplotlib.pyplot as plotfrom mpl_toolkits.basemap import Basemapfrom matplotlib.patches import Polygonfrom matplotlib.colors import rgb2heximport pandas as pdimport numpy as npplot.figure(figsize=(14 ,6 )) m = Basemap( llcrnrlon=77 , llcrnrlat=14 , urcrnrlon=140 , urcrnrlat=51 , projection='lcc' , lat_1=33 , lat_2=45 , lon_0=100 ) m.readshapefile(r'../CHN_adm/CHN_adm1' , 'states' , drawbounds=True ) df = pd.read_excel(r'../A0101a.xls' ) df['省名' ] = df.地区.str [:2 ] df.set_index('省名' , inplace=True ) statenames=[] colors={} cmap = plot.cm.Blues vmax = 100000000 vmin = 3000000 for shapedict in m.states_info: statename = shapedict['NL_NAME_1' ] p = statename.split('|' ) if len (p) > 1 : s = p[1 ] else : s = p[0 ] s = s[:2 ] if s == '黑龍' : s = '黑龙' statenames.append(s) pop = df['人口数' ][s] colors[s] = cmap(np.sqrt((pop - vmin) / (vmax - vmin)))[:3 ] ax = plot.gca() for nshape, seg in enumerate (m.states): color = rgb2hex(colors[statenames[nshape]]) poly = Polygon(seg, facecolor=color, edgecolor=color) ax.add_patch(poly) plot.show()
Sooooooooooo beautiful!!!
Author : o_oyao
License : All articles in this blog are licensed under
CC BY-NC-SA 4.0 unless stating additionally.